Banner image Link to Northern Research Station Home page Link to Forest Service Home page Link to Forest Service Home page Link to United States Department of Agriculture website
You are here:   Climate Change Atlas / Tree Atlas / Summary of Predictors / Predictor Importance Boxplots
Boxplots of Predictor Importance Scores
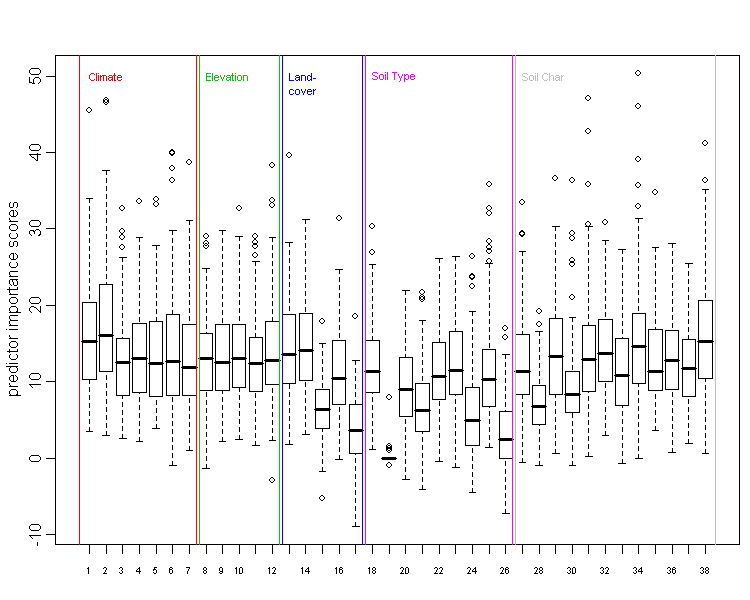
The graph below allows you to browse the boxplots of predictor importance scores (summed over the 134 tree species), as assessed by the RandomForest model, by each group.   Context-Sensitive Help    
    NOTE: The boxplot is imagemapped - click for various outputs

                   NOTE: Click X-axis for predictor name equivalents